Payment Gateway Transactions' Exploratory Data Analysis
The exercise
mCom is a fictitious eCommerce application. Like most eCommerce platforms, it has a catalog of products and a bunch of merchants. Buyers select products they wish to purchase and the sellers service those purchases.
mCom is integrated with multiple payment gateways. It uses a third party PG aggregator (like JusPay) to route each incoming transaction to one of the payment gateways. In order to make a payment, the user can select any of the available payment modes such as a credit card, netbanking, UPI etc.
The file below is a sample of 50,000 transactions over a period of time. The brief was to analyse it, pull out whatever insights were there, and make recommendations off the back of them.
Download the raw transactions data (CSV, 4.8 MB)
Download the cleaned workbook (XLSX, 4.1 MB)
Data cleanup and sanity checks
On doing a data cleanup and on conducting data sanity checks, we identify that the data is mostly clean and has no major anomaly outliers.
Trends and observations
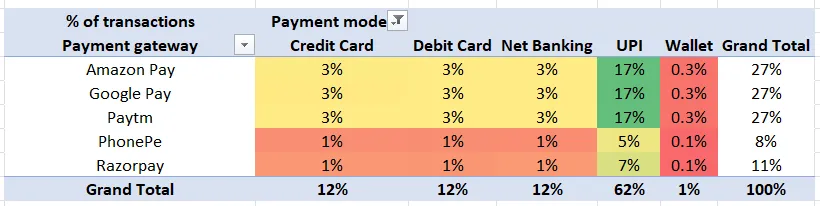
Here is how transaction volume splits across payment modes and payment gateways. UPI is 62% of everything.
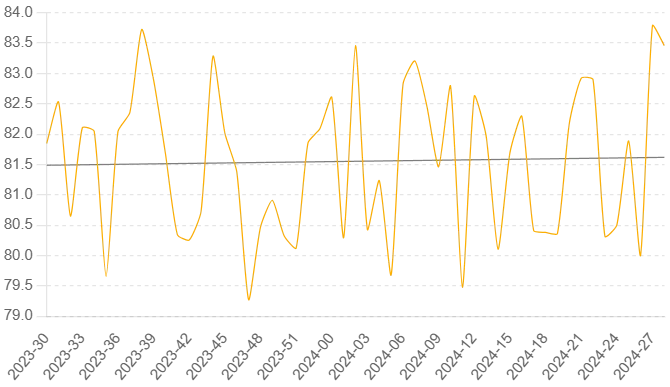
Overall payment success rate stays flat at around 80% across the whole period.
The average hides the interesting part. Success rate by payment mode is not remotely even:
| Mode of payment | Start of trendline | End of trendline | Difference |
|---|---|---|---|
| UPI | 96.1 | 95.9 | -0.2 |
| Credit Card | 78.8 | 81.2 | 2.4 |
| Wallet | 45.9 | 51.8 | 5.8 |
| Debit Card | 47.9 | 47.2 | -0.7 |
| Net Banking | 47.4 | 47.2 | -0.2 |
UPI clears 95% of the time. Debit cards and netbanking sit at 47%, and they are not improving. Credit cards and wallets are the only two modes trending up.
Within UPI, PhonePe and Razorpay are noticeably better than the rest:
| Payment gateway | Start value | End value | Difference |
|---|---|---|---|
| Razorpay | 99.27 | 99.58 | 0.30 |
| PhonePe | 98.97 | 99.22 | 0.26 |
| Amazon Pay | 95.19 | 95.22 | 0.03 |
| Paytm | 95.40 | 95.03 | -0.37 |
| Google Pay | 95.54 | 95.03 | -0.51 |
And within credit cards the ranking is different again, with Google Pay and Paytm improving fastest while Razorpay drops nearly five points:
| Payment gateway | Start value | End value | Difference |
|---|---|---|---|
| Google Pay | 75.68 | 80.47 | 4.79 |
| Paytm | 75.18 | 79.75 | 4.58 |
| Amazon Pay | 77.03 | 79.02 | 1.99 |
| PhonePe | 90.62 | 88.09 | -2.53 |
| Razorpay | 93.54 | 88.63 | -4.90 |
Recommendations
- Prioritise UPI as a payment mode over the others.
- Within UPI, push more load to PhonePe and Razorpay, because the success rate is better there.
- If the user is going to pay by credit card, route that transaction to Google Pay or PhonePe.
To actually achieve this:
- Put UPI first in the payment journey rather than leaving it as one option among many.
- If the user picks something else, either redirect them to UPI or at least tell them success rates are lower on that channel.
- Gamify UPI with cashbacks.
- For credit cards, pre-fill as much customer data as possible.
How Swiggy already does this
Swiggy follows almost exactly this set of guidelines in its own payment journey, so it is worth walking through.
Because the user has previously paid by UPI, Swiggy has already selected UPI as the default on the final pre-payment page.
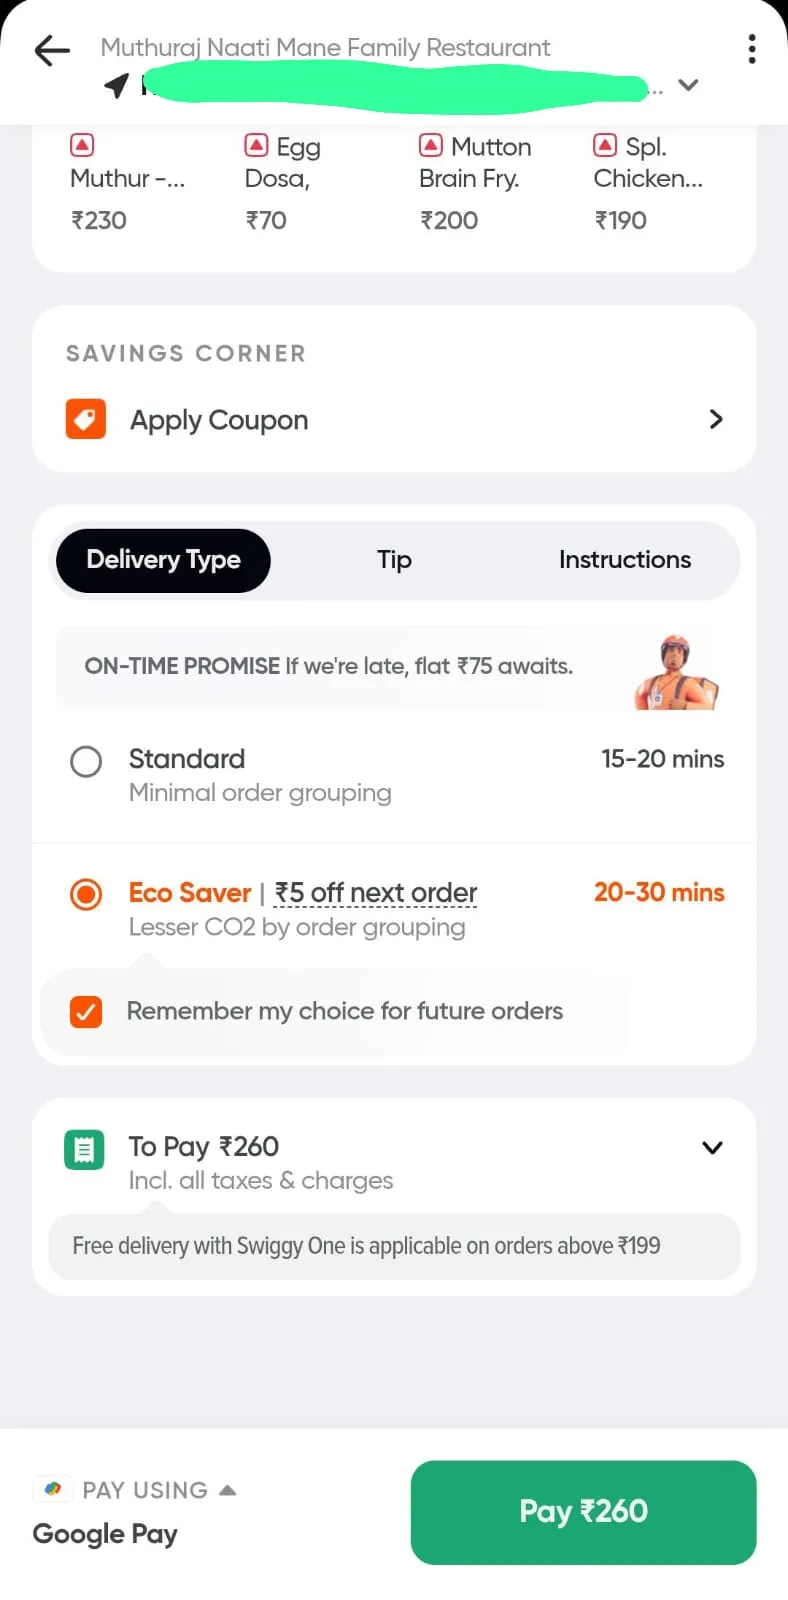
On clicking Apply Coupons, Swiggy shows a long list of discounts and cashbacks for UPI as well as other modes, which gamifies the choice of payment mode.
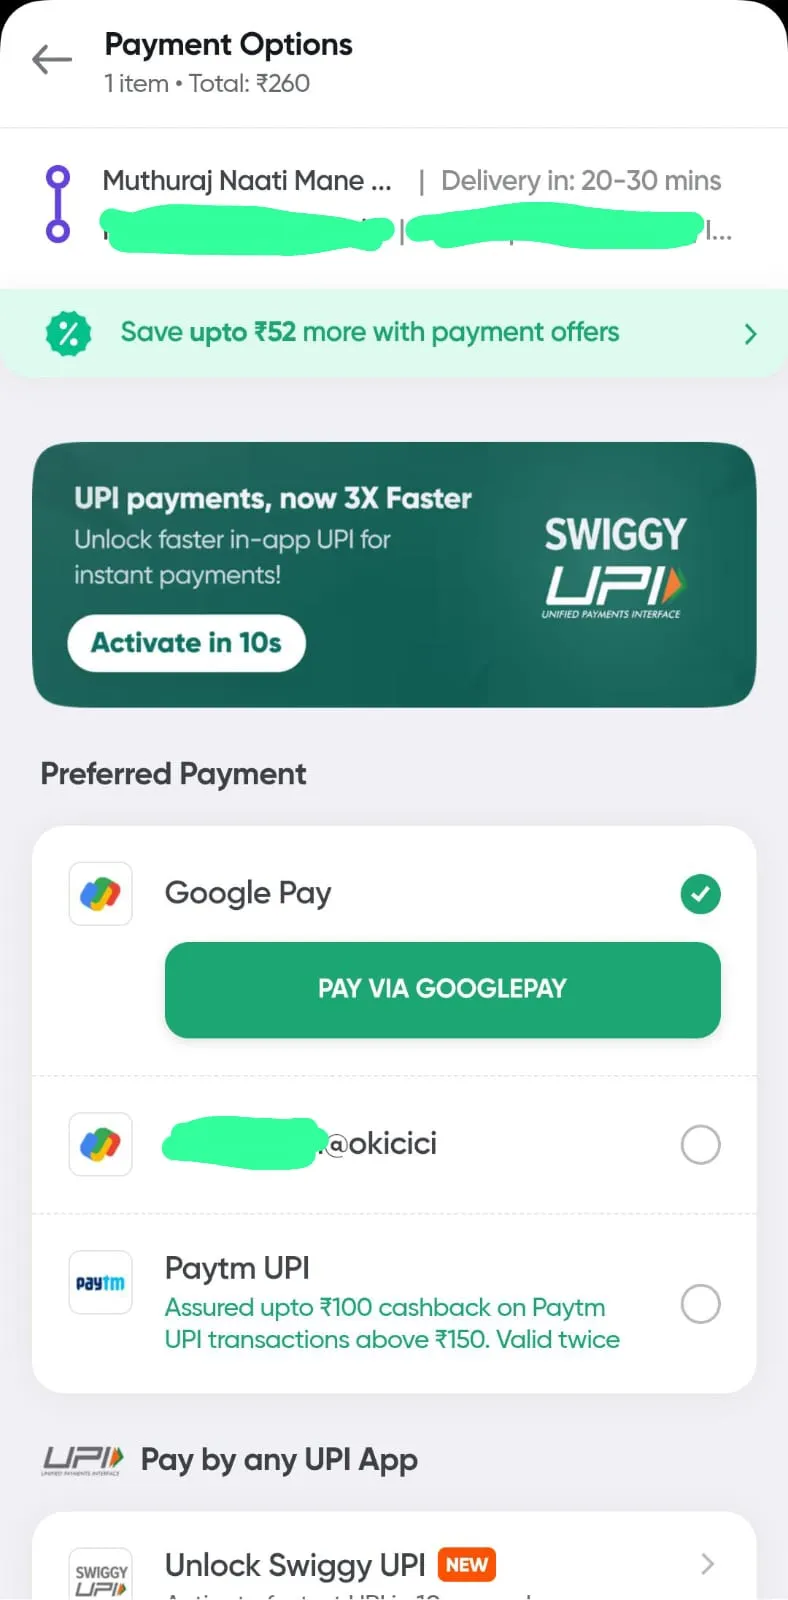
If the user does choose to change payment mode, the list that appears is ordered deliberately. Swiggy has its own UPI licence, so that goes on top to reduce reliance on other UPI apps. After that come specific UPI apps, Google Pay first and then Paytm UPI. This flow suits someone who has been paying by UPI all along.
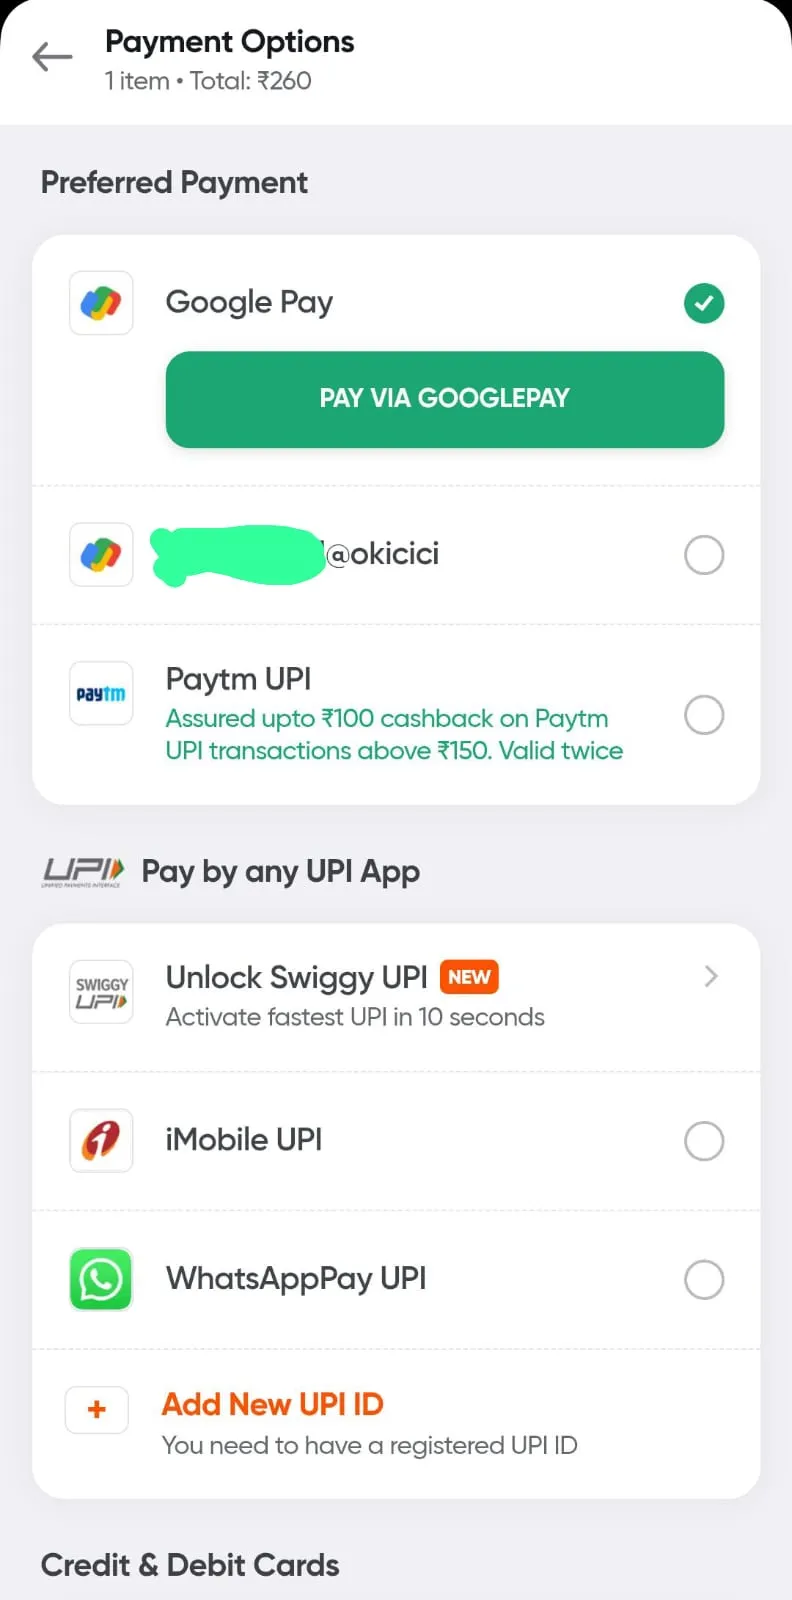
Other UPI options are still highlighted before anything else appears. Only at the end do debit and credit cards, wallets and cash on delivery show up. For a new user with no payment history, putting Add New UPI ID at the top is the right default.
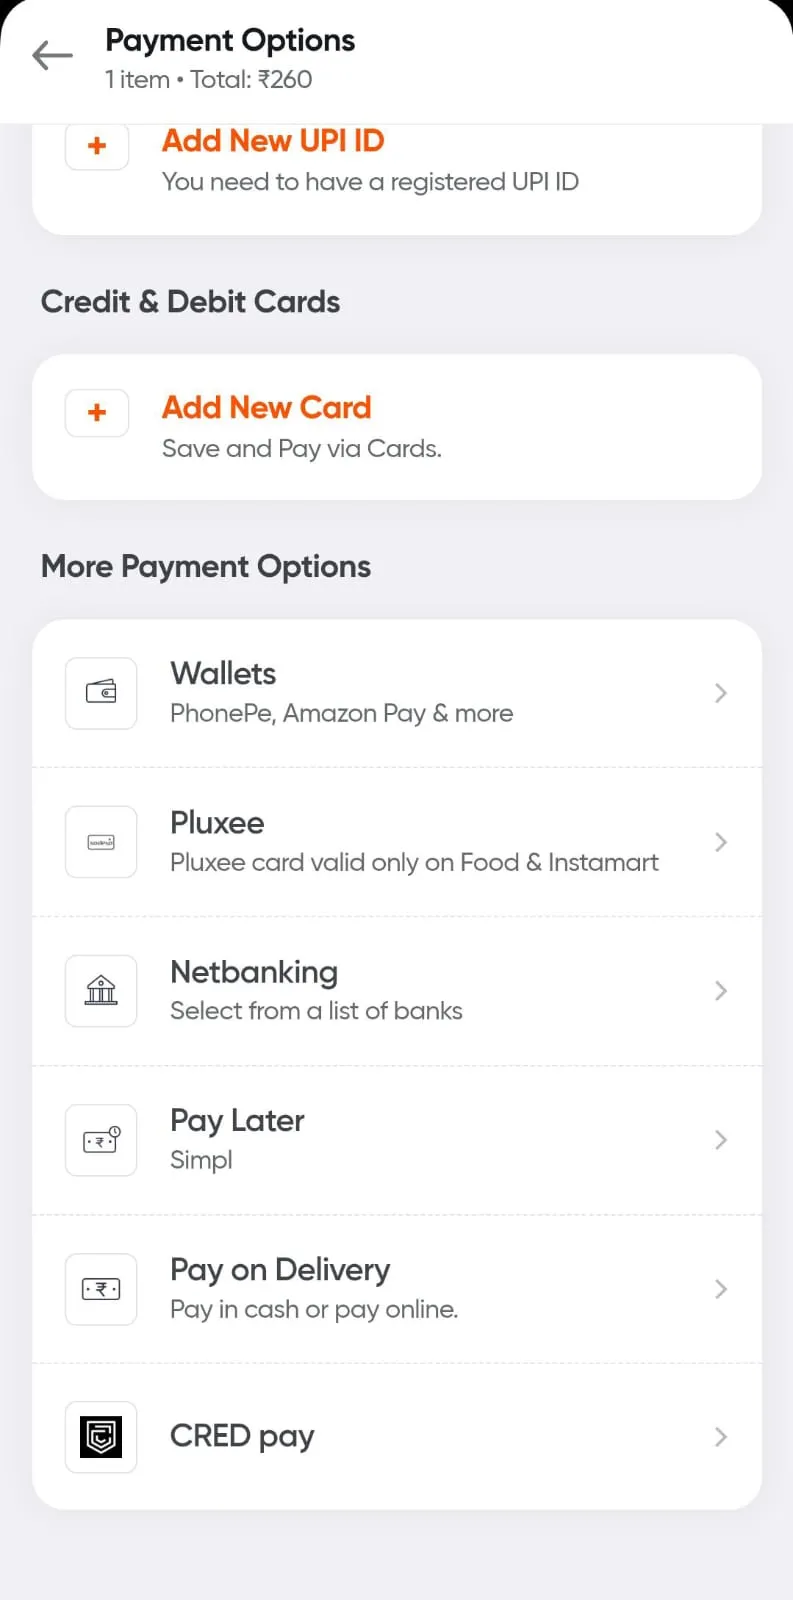
Two more rules fall out of this. If the user has consistently paid through some other mode, that mode should be their preferred option instead of UPI. And on a failed transaction, nudge the user towards an alternate mode rather than letting them retry into the same wall.
Dead ends I explored
Worth writing down the things that did not go anywhere, because I spent time on them:
- No strong correlation between transaction amount and payment mode, or between transaction amount and success rate.
- No strong correlation between location ID, user ID or merchant ID and either payment mode preference or success rate.
- No real repeat purchase behaviour. Very few users place repeat orders, and the average order value of a repeat purchase is about the same as the first one.